OVERVIEW
A fuel surcharge can quietly spike 5x or 10x in a few months, and most buyers never notice until the margin is already gone. Distributors don't compete on core product prices; they recover margin through the fees that ride alongside them: fuel, freight, delivery, tariffs. Tracking those by hand means exporting invoices into a spreadsheet, one vendor at a time.
The Surcharge Tracker dashboard does that work for you. It surfaces every surcharge line item already captured on your invoices, classifies each one into a category, and shows the trends by vendor, category, location, and time period, so you can walk into a vendor renegotiation, push back on unexpected fees, and report cost trends accurately to leadership.
The dashboard helps you answer questions like:
How much am I spending on surcharges, and is it going up?
Which vendors are driving most of my surcharge cost growth?
What types of surcharges am I paying (fuel, delivery, tariff, freight), and which one is the biggest contributor?
Have any new surcharges shown up, or has any vendor had a big jump in surcharge spend?
HOW IT WORKS
The dashboard reads the invoice line items already captured in your Ottimate account and identifies anything that looks like a surcharge or fee (a line named "surcharge," a delivery fee, a freight charge, a fuel fee, and similar). It then classifies each one into a category based on the line item name, and rolls up the totals by vendor, category, location, and time period.
The dashboard uses 9 surcharge categories:
Fuel: fuel surcharge, fuel fee, diesel, gasoline
Delivery: delivery fee, delivery charge, delivery surcharge
Energy / Environmental: energy fee, environmental fee
Tariff: tariff fee, tariff surcharge
Freight: freight, freight charge, freight surcharge
Pallet: pallet fee, pallet charge
Taxes / Fees: tax surcharge, regulatory fee
Driver Retention: driver retention fee, driver surcharge
Other: any surcharge that doesn't match the categories above
All dashboard metrics are calculated on the invoice date, so the date filter controls when the invoice was issued, not when it was paid.
Note: Some vendors (utility, telecom, energy, waste) bundle regulatory taxes and public service fees into line items that look like surcharges. The dashboard shows a banner reminding you of this. For those vendors, read the totals with that in mind, or filter the vendors out for a cleaner view of true product surcharges.
WHERE CAN I FIND THE SURCHARGE TRACKER DASHBOARD?
The Surcharge Tracker dashboard appears in the Dashboard area of the Reports module.
Reports → Dashboard → Surcharge Tracker
HOW DO I USE THE SURCHARGE TRACKER DASHBOARD?
Open Reports → Dashboard → Surcharge Tracker.
Set your filters at the top: date range, company, vendor, and location.
Read the Overview page for the headline numbers, then move to Details, Surcharge Explorer, or Alerts depending on what you need.
Click into any vendor, surcharge group, or line item for the detail behind a number. Your filters carry across tabs, so the context stays consistent as you navigate.
Click Export CSV on the Details or Surcharge Explorer page to pull the current view into a worksheet for your vendor meeting.
HOW DO I USE THE DATE FILTER TO FILTER FOR A SPECIFIC INVOICE DATE RANGE?
Use one of the preset buttons (1M, 3M, 6M, 12M) for a quick range.
For an exact window, click the From and To date inputs and pick the dates you need.
The date range persists as you move between Overview, Details, Surcharge Explorer, and Alerts. To reset the entity filters (company, vendor, location) while keeping the date range, click Clear.

WHAT ARE THE ELEMENTS OF THE SURCHARGE TRACKER DASHBOARD?
The dashboard has four pages, each answering a different question.
1. Overview: How much am I spending on surcharges, and is it going up?
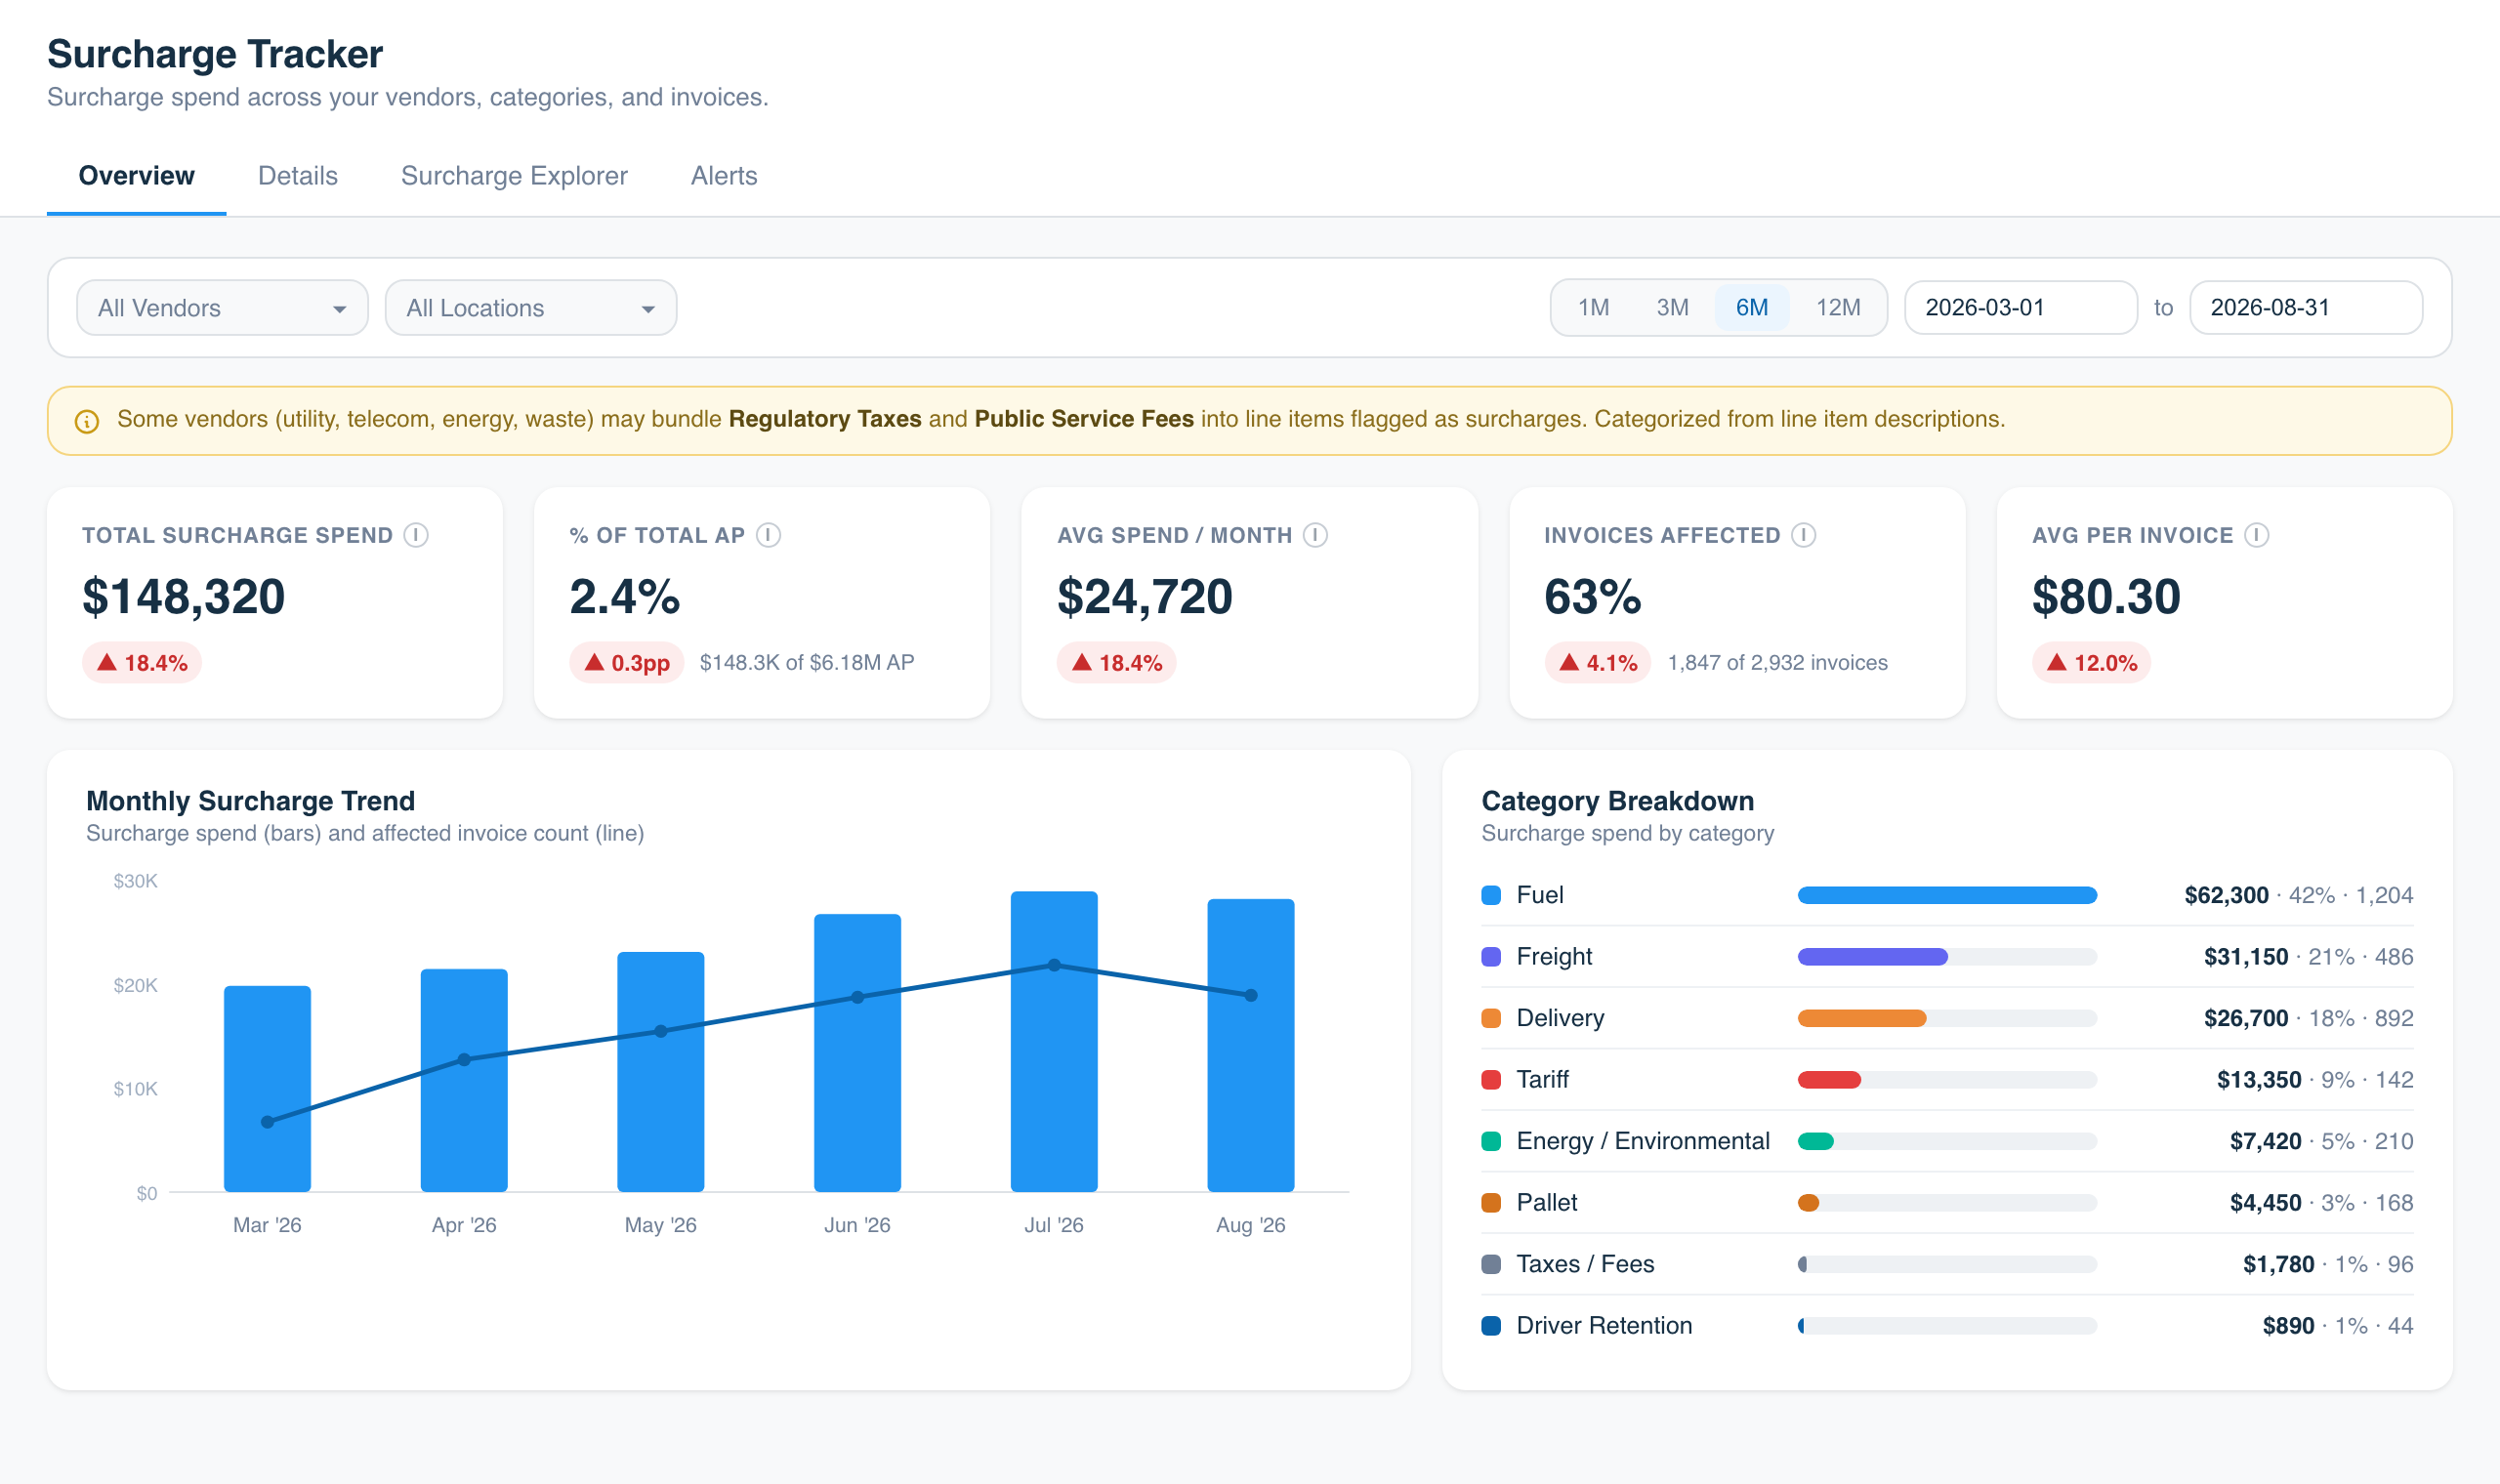
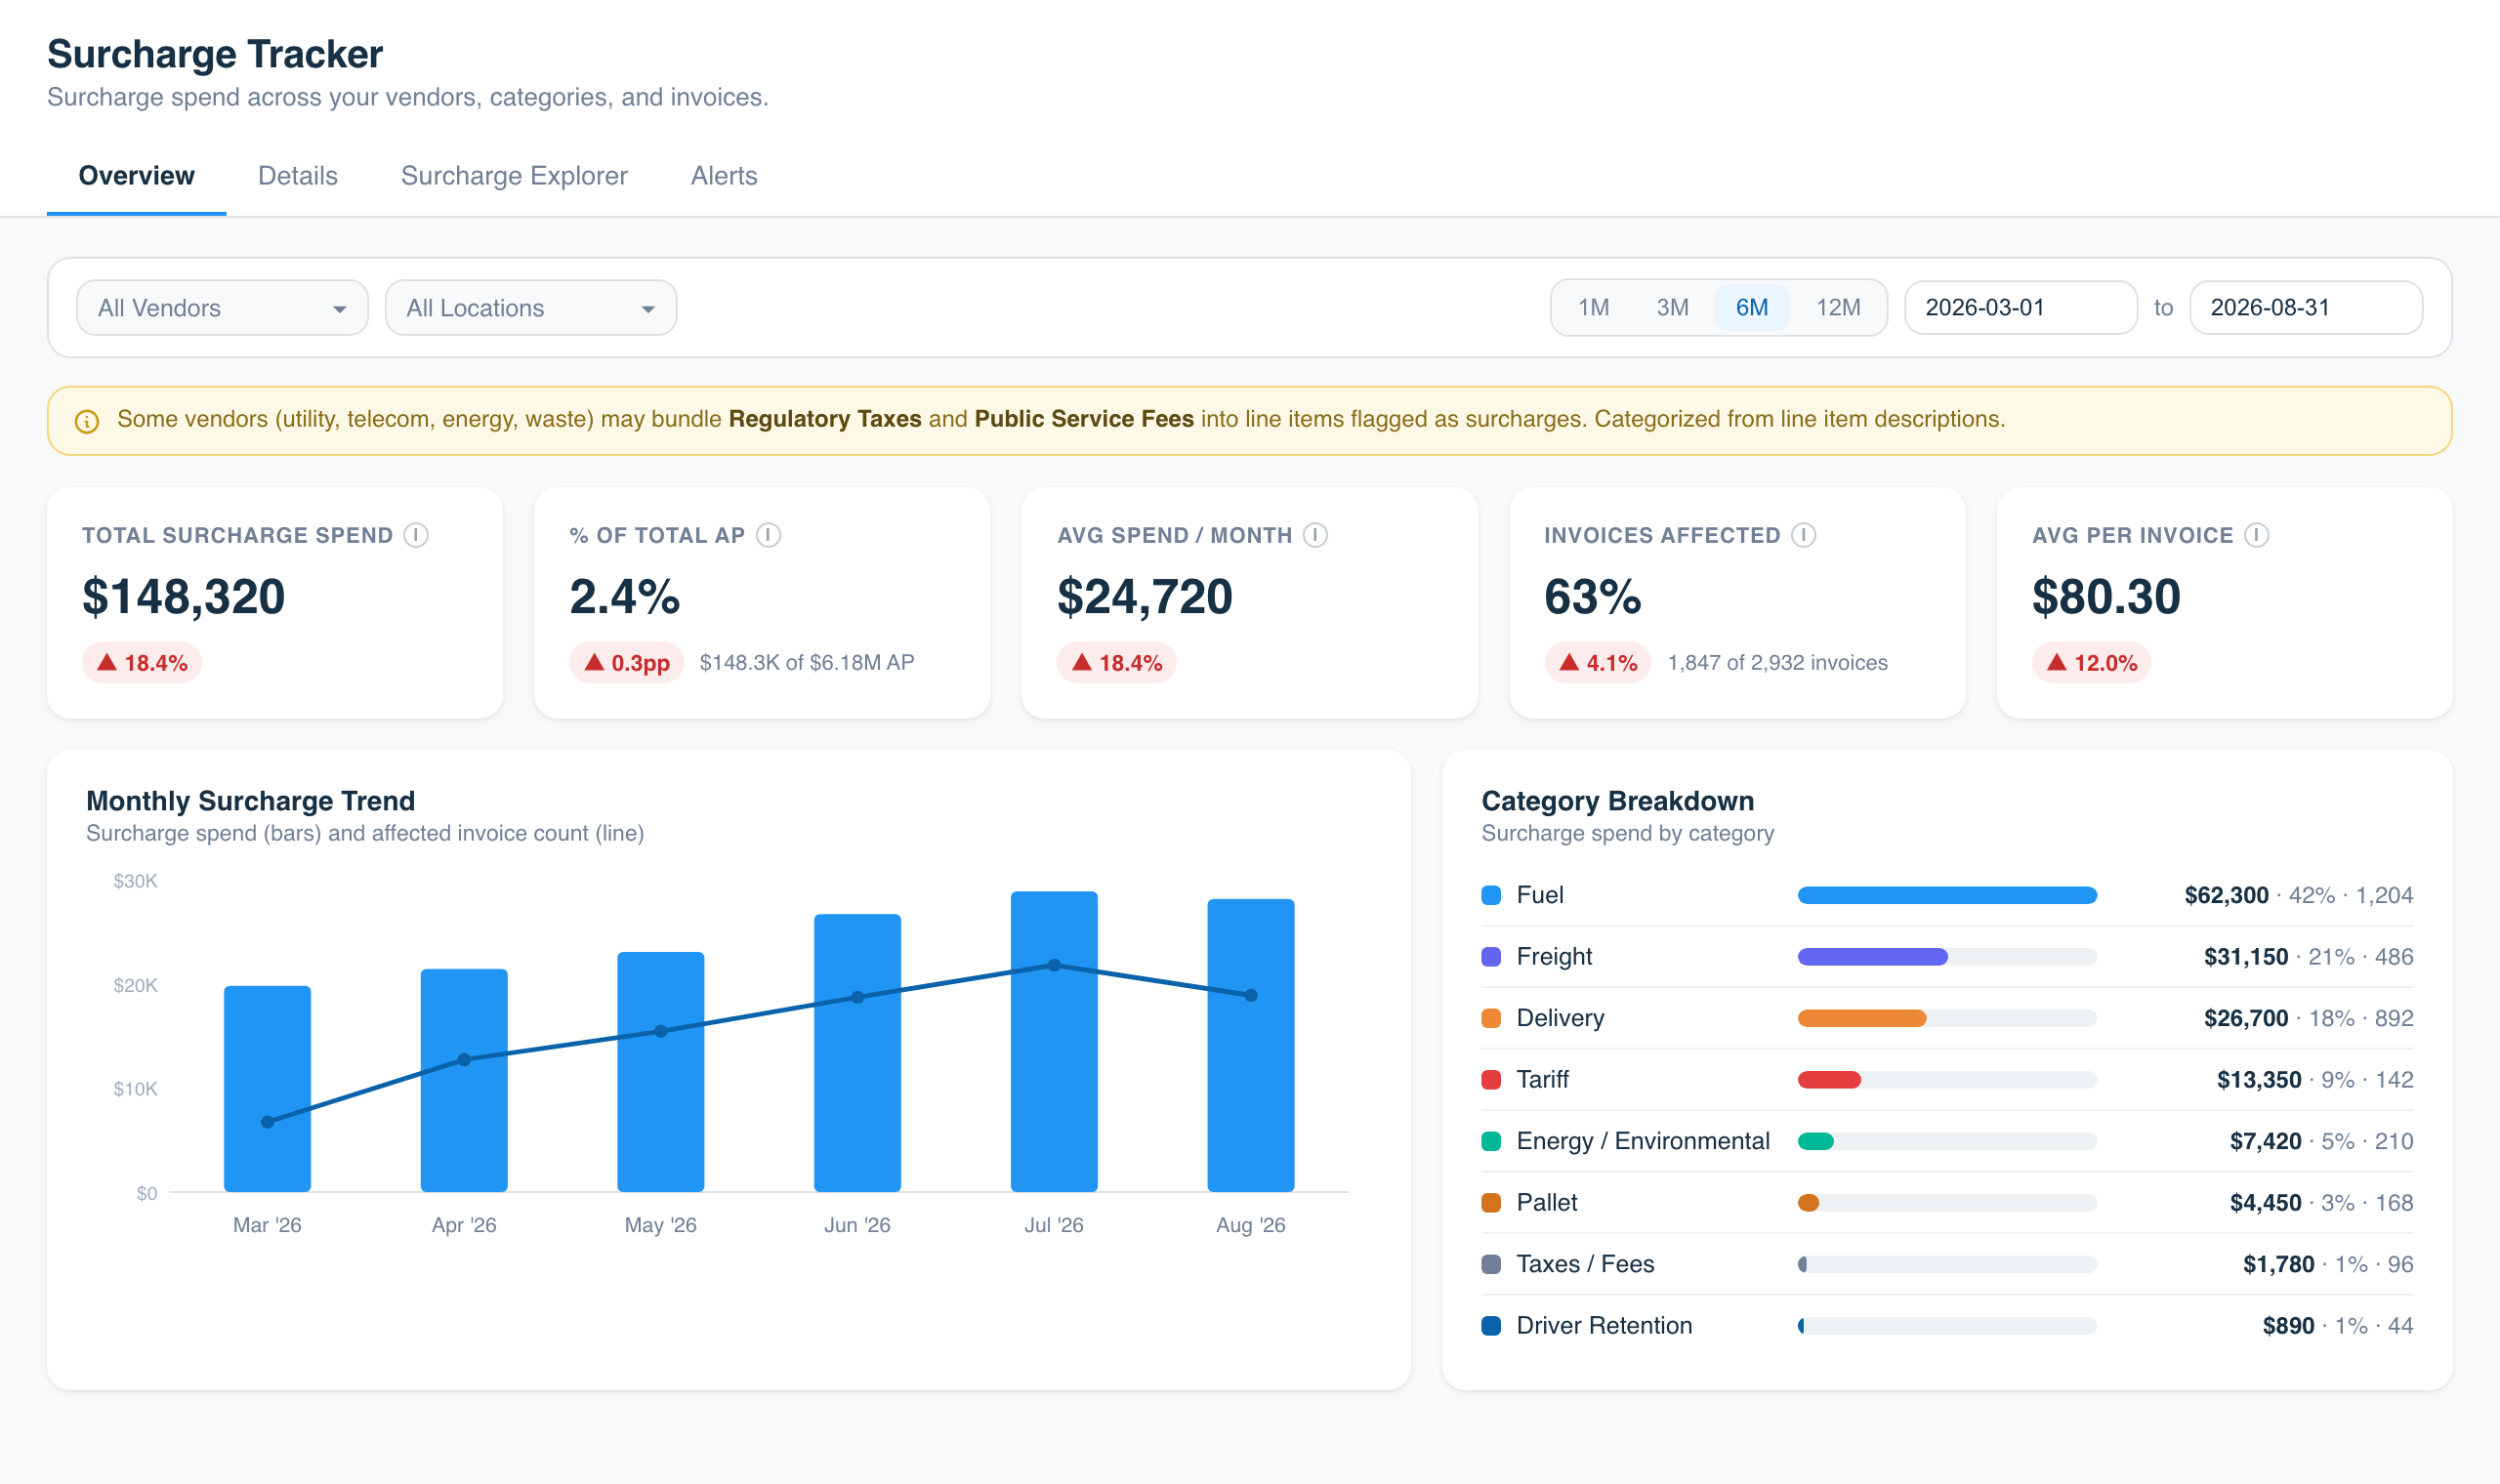
Five KPI cards run across the top, each showing the change versus the prior period:
Total Surcharge Spend: total dollars across all surcharge line items in the selected period.
% of Total AP: surcharge spend as a share of your total accounts payable spend.
Avg Spend / Month: average monthly surcharge spend over the selected range.
Invoices Affected: percentage of your invoices that have at least one surcharge line.
Avg per Invoice: average surcharge cost per invoice that contained surcharges.
Monthly Surcharge Trend: monthly surcharge spend (bars) overlaid with the count of affected invoices (line). Hover any month to see total spend, dollars per invoice, and invoice count.
Category Breakdown: surcharge spend grouped by category, with each category showing total spend, its share of overall surcharge spend, and line count.
2. Details: Which vendors are driving surcharge costs, and what's the pattern?
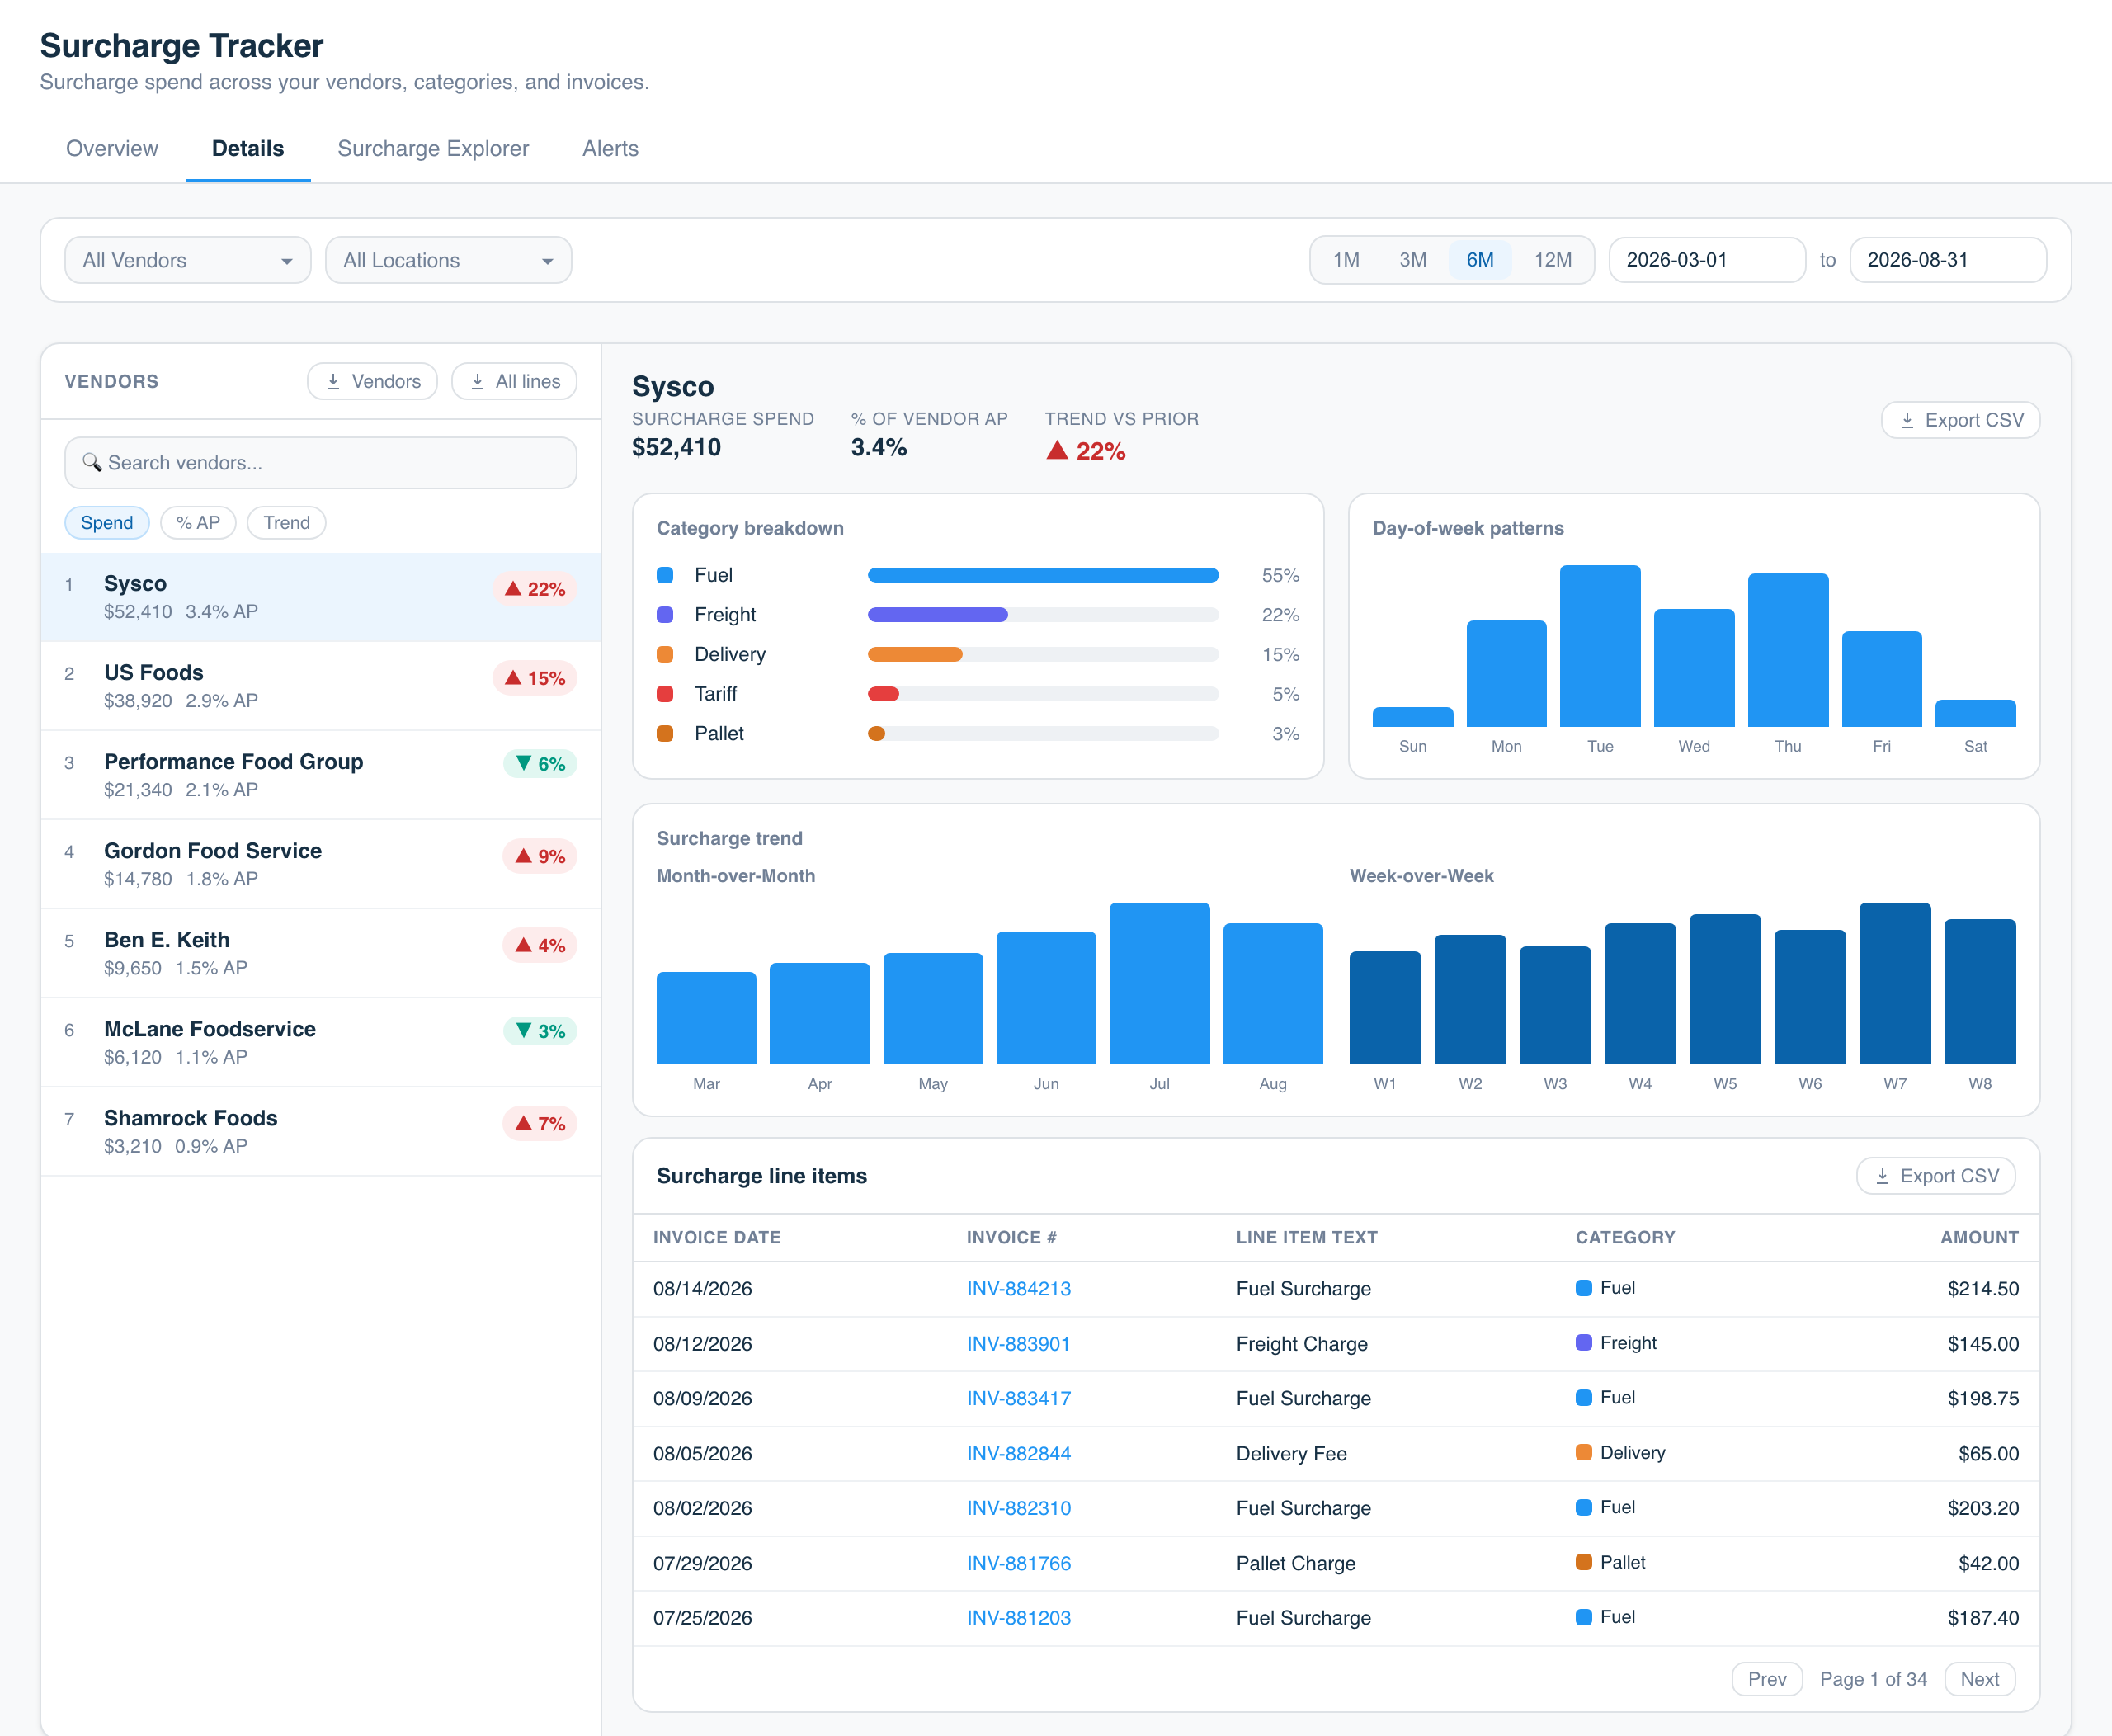
A split view with the vendor list on the left and detailed analytics on the right.
Vendor list: searchable and ranked by surcharge spend. Each row shows the vendor name, surcharge spend, surcharge as a percentage of that vendor's total AP, and a trend badge (up or down versus the prior period). Sort by spend, % AP, or trend.
Vendor detail (right pane, click any vendor to populate):the vendor name and headline totals, with an Export CSV button.
Category breakdown: that vendor's surcharge spend split by category.
Vendor trend: spend over time, shown as month-over-month and week-over-week views (each appears when your selected date range has enough data to support it).
Day-of-week patterns: a bar chart showing which delivery days drive the most surcharge spend, helpful for spotting whether a vendor charges more on specific days.
Invoice-level table: a paginated, sortable list of every surcharge line for that vendor, with invoice date, invoice number, line item text, category, and amount. Click any invoice to open it in Ottimate.
3. Surcharge Explorer: What types of surcharges am I paying, and what are the individual line items?
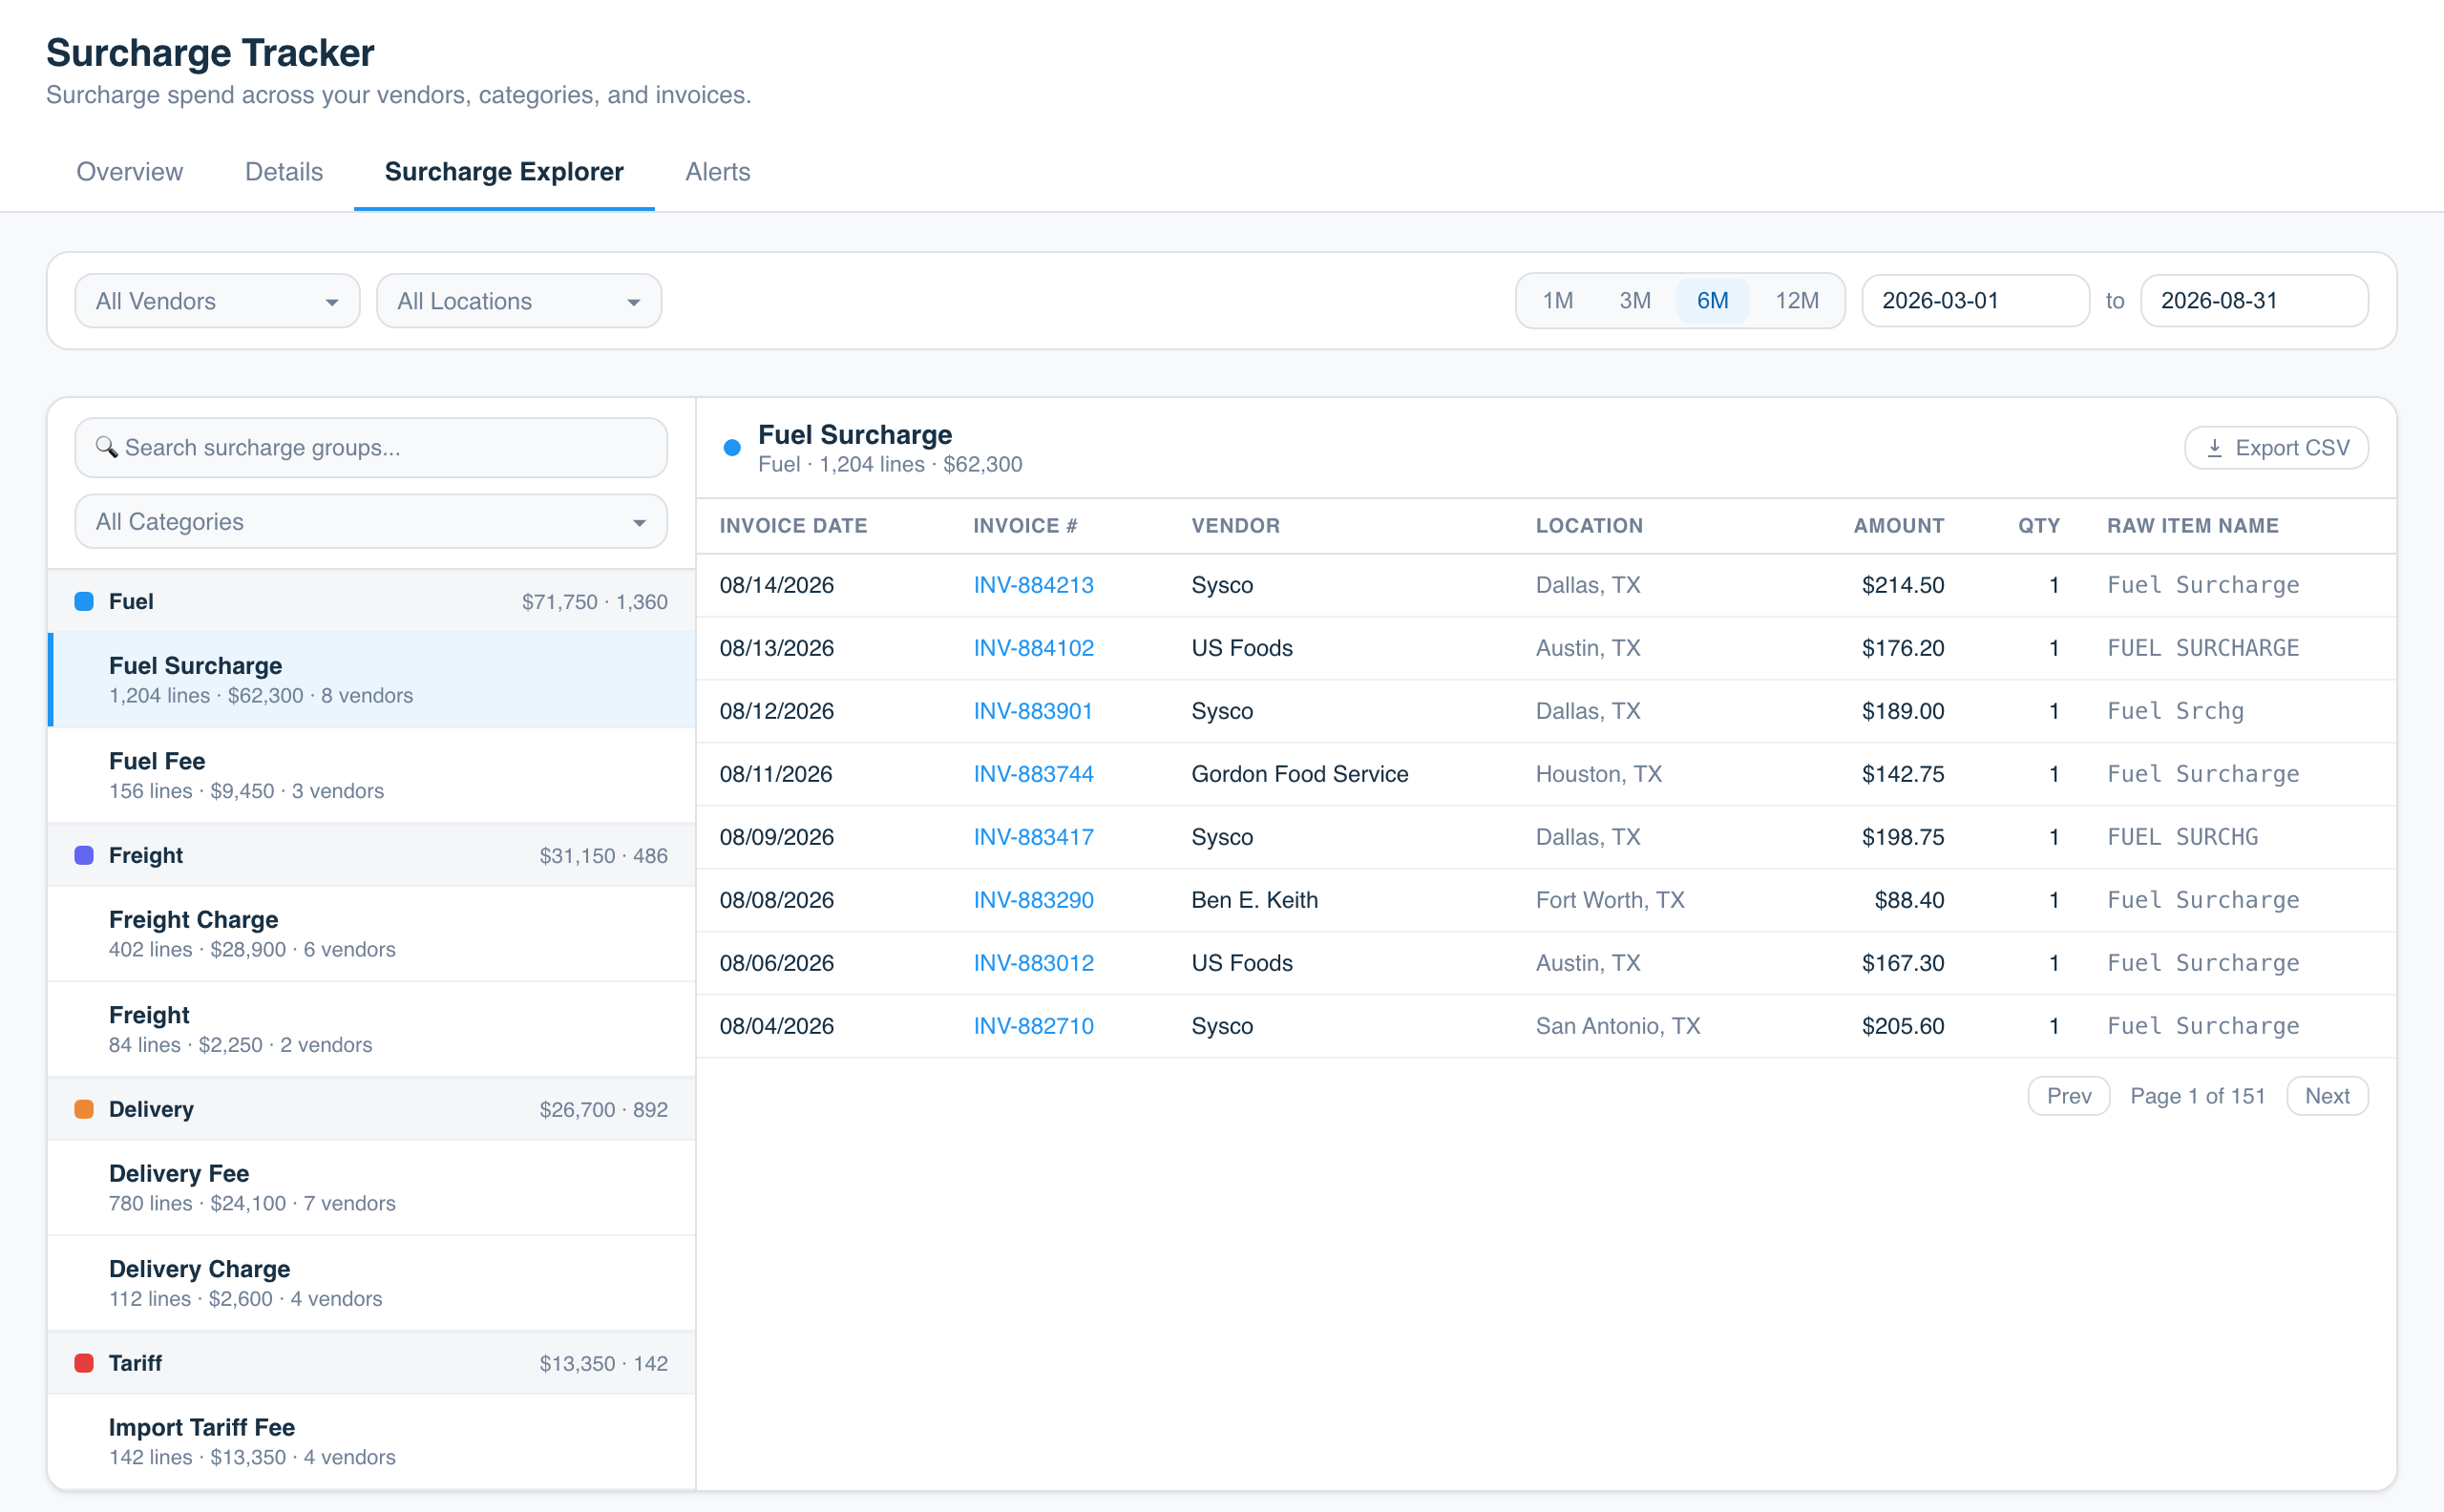
A split view that groups surcharge line items by normalized name (for example, all the scanned variants of "fuel surcharge" rolled up into one group) and lets you drill into each group's individual lines. You can search the groups by name and filter them by category.
Group panel (left): groups are organized by category. Each group shows the normalized name, line count, total spend, and how many vendors it spans.
Line items table (right): every individual surcharge line in the selected group, with invoice date, invoice number, vendor, location, amount, quantity, and the raw item name as it appeared on the invoice. An Export CSV button pulls the selected group's lines.
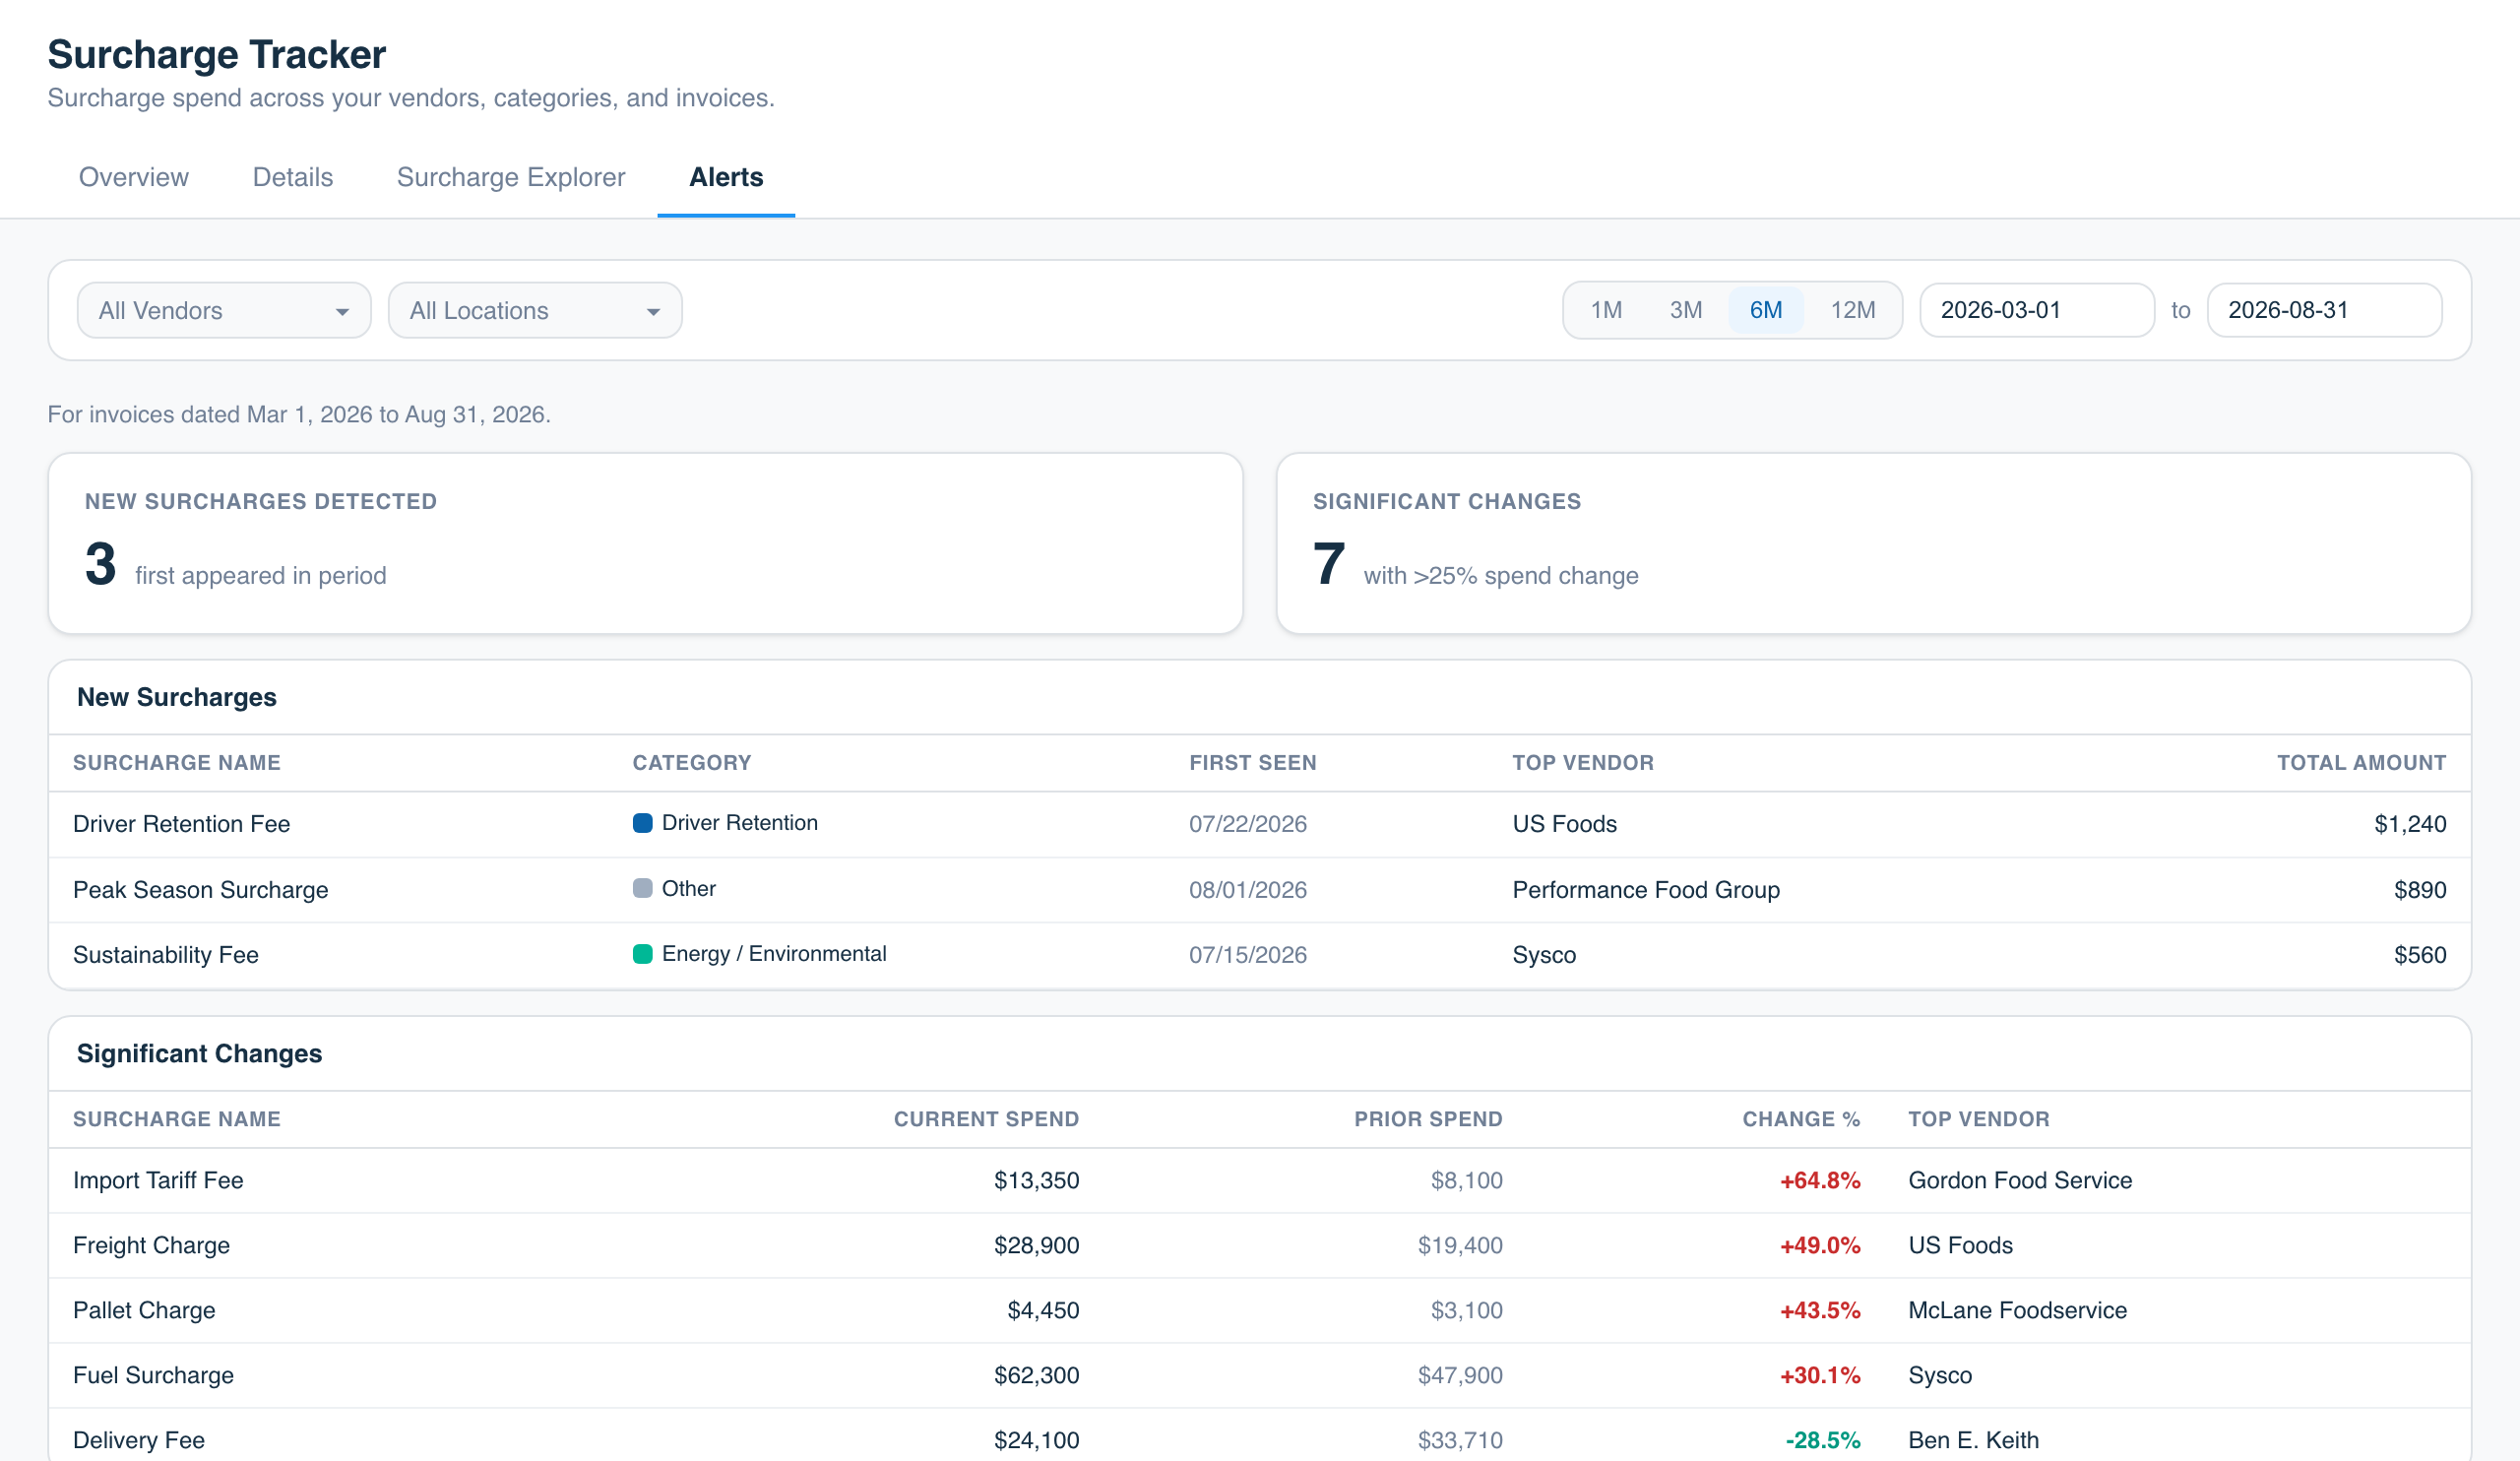
4. Alerts: Are there new surcharges or vendors with sudden cost changes?
Two summary cards at the top:
New Surcharges Detected: surcharge names that appear for the first time in the selected date range, with no prior history on your account.
Significant Changes: surcharge names where spend changed by more than 25% compared to the equivalent prior period.
Below each card, a paginated table breaks the alerts down:
New Surcharges table: surcharge name, category, first-seen date, top vendor, and total amount in the period.
Significant Changes table: surcharge name, current period spend, prior period spend, change % (color-coded up or down), and top vendor.
FILTERS AVAILABLE ON THE DASHBOARD
All filters apply to every page and persist as you move between Overview, Details, Surcharge Explorer, and Alerts.
| Filter | Description |
|---|---|
| Date range | Presets (1M, 3M, 6M, 12M) or a custom From / To range. Defaults to the last 3 months. |
| Company | Multi-select, searchable. Shown only if your account has more than one company. |
| Vendor | Multi-select, searchable. |
| Location | Multi-select, searchable. |
A Clear button resets the company, vendor, and location filters while keeping your date range intact.
EXPORTING YOUR DATA
You can export what you see to a CSV, and every export respects your current filters. Export is available in two places:
Details: the vendor list has a Vendors export (the vendor summary) and an All lines export (every surcharge line across your vendors). A selected vendor's pane has its own Export CSV for that vendor's lines.
Surcharge Explorer: with a group selected, Export CSV pulls that group's individual line items.
ACCESS & PRICING
The Surcharge Tracker dashboard requires the same two reporting permissions as the Operational Efficiency and Use Tax Review dashboards: View Admin Reports and View Analytics Dashboards. A user needs both, not either one. If you can already open those dashboards, you can open Surcharge Tracker.
If you or someone on your team can't find the dashboard, they're likely on a "View" only or "No-Access" role. Ask a user with Administrator role permissions to enable both the View Admin Reports and View Analytics Dashboards permissions for that user.
Access is scoped on every query: you see data only for the account(s) you belong to, and within an account, only the locations you have access to. The dashboard is included at no additional cost.
FAQs
What counts as a "surcharge" on this dashboard?
Any invoice line item whose name contains "surcharge," plus similar fee-type lines like delivery fees, freight charges, and fuel fees. The dashboard then classifies each one into a category based on the line item text: Fuel, Delivery, Energy / Environmental, Tariff, Freight, Pallet, Taxes / Fees, Driver Retention, or Other.
How far back does the data go?
12 or more months of history is available. The exact range depends on how long your account has been on Ottimate and how much invoice history has been processed. Use the custom date range to reach back as far as your history allows.
How current is the data?
The dashboard reads the same invoice data already flowing into your Ottimate account. If an invoice is in Ottimate, its surcharge lines appear here after a short processing delay.
Does the dashboard show all my locations?
It covers every location you have access to within your account. Use the Location filter to focus on specific sites or compare across them.
Some line items look like taxes or regulatory fees, not surcharges. Why?
Some vendors (utility, telecom, energy, waste) bundle regulatory taxes and public service fees into line items that look like surcharges. The dashboard shows a banner reminding you of this. For those vendors, read the totals with that context in mind, or filter the vendors out for a cleaner view of true product surcharges.
A surcharge on my invoice looks misclassified. What do I do?
Classification is keyword-based on the line item name. If something is in the wrong category (for example, a tariff fee showing up under Other), flag it to Ottimate Support with the invoice number and the line item name. The product team can review and refine the classification rules.
Why don't I see any data in the dashboard?
Two common reasons. Your account may not have invoices with surcharge-related line items; roughly 40% of Ottimate accounts fall into this bucket, meaning their vendors aren't charging surcharges Ottimate can detect on their invoices. Or your account is new and doesn't have enough processed invoice history yet, in which case wait a few invoice cycles and check back.
Can I export the data to share with my vendor or finance team?
Yes. The Details page and the Surcharge Explorer page both have Export CSV buttons, and every export matches your current filters. On Details you can export the vendor summary, all surcharge lines, or a single vendor's lines; on Surcharge Explorer you can export a selected surcharge group's lines. See "Exporting your data" above.
Can I get email alerts when surcharges spike?
Email and in-app notifications are on the roadmap. For now, the Alerts page flags new surcharges and significant changes each time you open the dashboard. Checking it monthly is a good cadence for most operators.
Can I see how my surcharges compare to other Ottimate customers?
Not in the current version. Cross-account benchmarking (for example, "your fuel surcharges versus peers in hospitality") is on the future roadmap and requires data anonymization and consent frameworks before we ship it. For now, the dashboard shows your own data only.
How is this different from the Cost Overages dashboard?
Cost Overages compares item-level purchase prices to your own lowest historical price for that item from the same vendor, so it catches cost creep on the products you buy. The Surcharge Tracker focuses on the fee line items that sit alongside those products (fuel, delivery, freight, tariff) and shows trends, vendor patterns, and new-fee detection. Most operators benefit from using both: Cost Overages for product price slippage, Surcharge Tracker for hidden fee growth.
For further assistance, contact Ottimate Support by emailing support@ottimate.com or click the link here and submit a support ticket.
Was this article helpful?
That’s Great!
Thank you for your feedback
Sorry! We couldn't be helpful
Thank you for your feedback
Feedback sent
We appreciate your effort and will try to fix the article